Result Details
Orbital's Results Details page provides detailed information on a single query or script's results. This page can be accessed by clicking the query or script's Name link from the Results page.
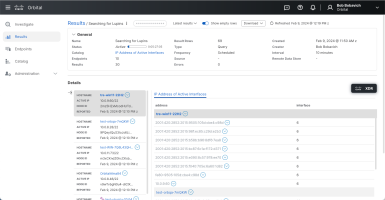
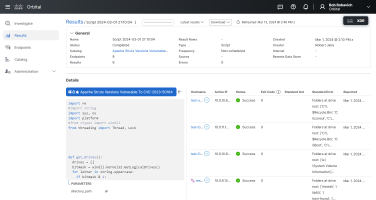
One important point to keep in mind is that the Result Details area of theResult Details page will be formatted differently depending on whether your are viewing a query or a script. The figures below show the difference between the Result Details page for a query and for a script.
| Query | Script |
|
|
This page consists of two major areas, the Query/Script Details area and the Query/Script Result Details area. The Query/Script Details area displays the same type of information irrespective of whether or not the results are from a query or a script. The Query/Script Result Details area will have a different information layout depending on whether or not the results are from a query or a script.
Query/Script Details Area
This area of the Result Details page is, itself composed of two sub-areas, the Result Detail Controls sub-area and the General Information sub-area.
The Result Detail Controls Sub-area
The Result Detail Controls sub-area, shown in the figure below, is used to control the information displayed on the Result Details page.

| Note: | The Show empty rows toggleswitch is only displayed in the Result Detail Controls sub-area that is controlling results for a specific query. This element is not displayed for the results of a script. |
The Result Detail Controls sub-area displays the following seven interface elements.
|
Results link |
This link will return you to the Orbital Results page. |
|
|
Query/Script Name |
This displays the name of the query or script that was run. The action menu, located at the right end of the query or script's name, contains the following three or four commands, depending if the results are for queries or scripts: |
|
|
|
Action Menu for Queries |
Action Menu for Scripts |
|
|
|
|
MITRE ATT&CK Indicator |
This display identifies which MITRE ATT&CK tactics and techniques the query or script adheres to. Refer to the What is MITRE Att&ck? topic for more information on MITRE ATT&CK. |
|
| Note: | The MITRE ATT&CK Indicator will only be displayed if the query was a stock query. Refer to the Orbital Catalog topic for more information on Stock Queries. |
|
Latest results |
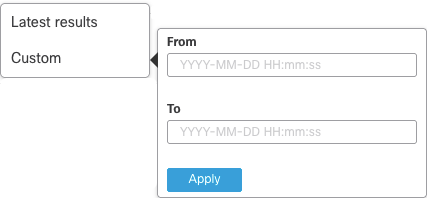
This dropdown, shown below, is used to filter the displayed results:
The Latest results dropdown command displays the last result received from each endpoint. The Custom dropdown command is used to define the date range of the results that will be displayed on the Results Details page. The From and To time input fields take on the format YYYY-MM-DD HH:mm:ss, where: YYYY represents the year MM represents the month. DD represents the day. HH represents the hour. MM represents the minute. SS represents the second. |
|
Show empty rows |
This toggle will only be displayed if the results being listed are for a query. It allows you to include or exclude rows that have not returned queried information, for whatever reason, to the query results. The default setting for this toggleswitch is off. |
|
Refreshed |
Click Refreshed to display any new results that were collected from endpoints that were non-responsive during the query's previous run. Any changes are displayed immediately, assuming the data is still available. |
|
Download |
Clicking the Download icon will display the File Type Selector, shown in the figure below. Select the file format, either JSON or CSV to download the host information in.
|
The General Information Sub-area
The General Information sub-area, shown in the figure below, is used to display information specific to the query or script being displayed.

This sub-area displays the following 14 user interface elements:
|
Show/Hide Arrow |
This arrow will either show or hide the General Query Information sub-area. If this sub-area is displayed, clicking the Show/Hide arrow once will hide the sub-area. If the sub-area is hidden, clicking the Show/Hide arrow once will display the sub-area. |
|
Name |
This field displays the name assigned to the query or script. |
|
Status |
This field displays the current status of the query or the script. If the query or scriptis in progress, a progress indicator will be displayed, as shown in the figure below.
If the query or script has finished execution, the date and time that the query or script finished executing is displayed. |
|
Catalog |
This field displays the name of the query or script, as it is listed in the Catalog. If the query or script has been created by the user, the value for this field will be Custom. |
|
Endpoints |
This field displays the number of endpoints that have returned query or script results. |
|
Results |
This field displays the total number of times that Orbital has received a response from all of the endpoints targeted by the query or script, over the duration of the query or script. |
|
Result Rows |
This field displays the total number of rows of results that have been returned for the query or script. |
|
Frequency |
This field displays whether the query or script is a scheduled or non-scheduled query or script. |
|
Source |
This field displays the name of the Cisco service where the query or script originated, such as Threat Response or Secure Endpoint. |
| Note: | If the query originates from Orbital itself, the Source field will be left blank. |
|
Errors |
This field displays the number of query or script results that are returned containing errors. |
|
Created |
This field displays the date and time that the query or script was started. This can be the date and time that the user created and ran a custom query or script, or the date and time that the user started running a stock query or script. |
|
Creator |
This field displays the name of the name of the user that created and/or ran the query or script. |
|
Interval |
This field will only display a value if the query or script is scheduled. If it is scheduled, this field displays the schedule's frequency value. This value is discussed in greater detail in the Schedule Query/Script Dialog section of the Orbital Builder topic. |
|
Remote Data Store |
This field displays the name of the remote data store that the query has sent the results to. This field will only display a value if the remote data store has been set. |
The Query/Script Result Details Area
The Query/Script Result Details area of the Result Details page is composed of two panes. The information displayed in these panes will change, depending on whether your are viewing the results for a query or script.
If you are viewing query results, the left-side pane will list the endpoints that have responded to the query and the right-side pane will display the results of the query, for that specific endpoint.
If you are viewing script results, the left-side pane will display the Python script that has been run, along with the script's parameters. The right-side pane will display the results of the script.
Query Result Details
When you are viewing the result details for a query, you will see the Result Details area shown in the figure below.

The left-side pane, shown in the figure below, is the endpoint list and is where Orbital lists all of the endpoints that have responded to the query.

This listing of endpoints is identical to the Endpoint List of the Results area of the Investigation page. Refer to the Endpoint List entry in the Investigation topic for more information on endpoint listing and its five screen elements.
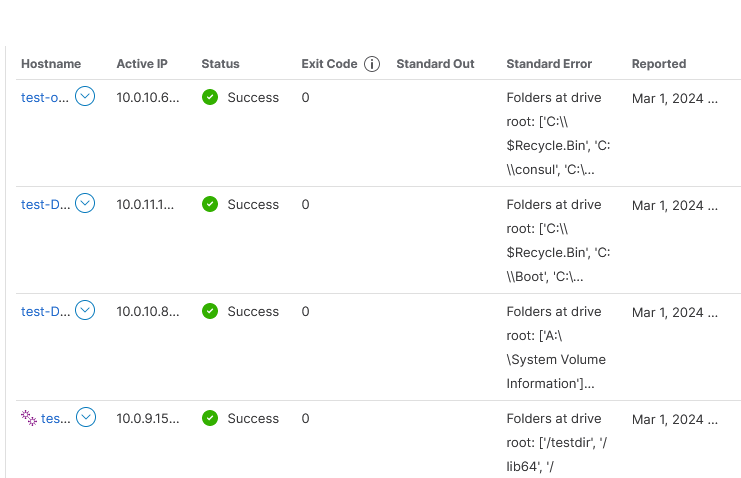
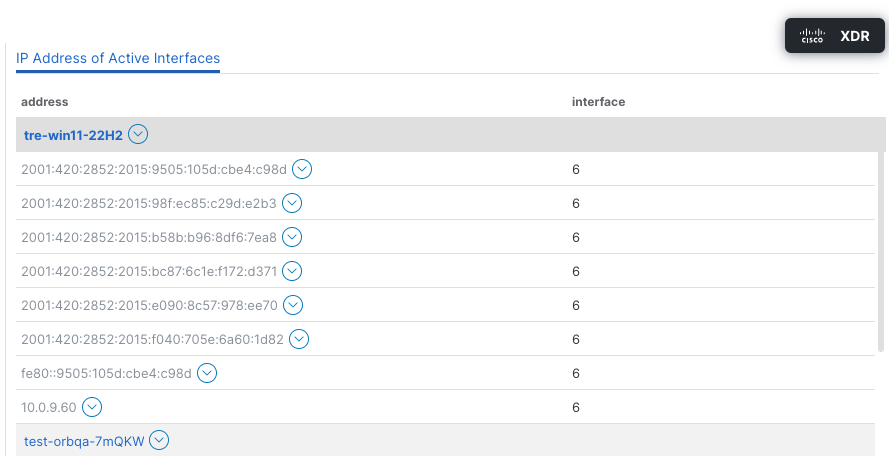
The right-side pane, an example of which is shown in the figure below, is the endpoint detailed results pane. This pane lists the detailed results for the query that is highlighted in the endpoint list. The information displayed in this pane will change depending on the tables being queried, the parameters of those queries, and the results being returned by the endpoint.
Script Result Details
When you are viewing the result details for a script, you will see the Result Details area shown in the figure below.

The left-side pane, shown in the figure below, displays the script that was run and any parameters that the script required.
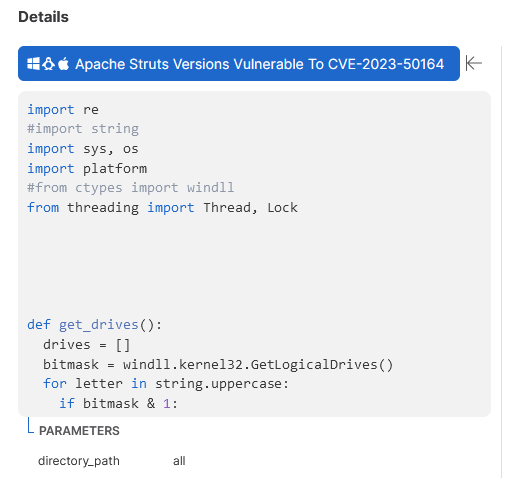
The script display pane had two user interface elements that you can use to manipulate the screen.
The first is used to hide or display the Python code for the script. Clicking the name of the script, contained in the blue header, will collapse the Python display and only display the script's name. Clicking again will expand Python display.
The second is the Script Collapse button. This element is used to hide or show the script. Clicking the button will hide the entire script from view and only show the script's detailed results. Clicking the button again will display the entire script.
The right-side pane, an example of which is shown in the figure below, is the endpoint detailed results pane. This pane lists the detailed results for the script that is highlighted in the endpoint list. The information displayed in this pane will change depending on the script being run.
